Welcome to Komodo 3.5
Komodo is ActiveState's multi-language, multi-platform integrated development environment (IDE).
|
|
|
|||||||||||
Getting started with Komodo is as easy as opening a file and beginning to edit. However, to ensure that you don't miss any of Komodo's features, take a look at the components of the Komodo workspace described below.
Next, Get Started Fast with Komodo's Sample Project. Use the Sample Project to familiarize yourself with Komodo's project management, editing features and debugging functionality.
New in this Beta Release
This is a Beta release, providing a preview of the new features and improvements in Komodo 4.0.
- Vi emulation: Modal keybindings which emulate the navigation, text insertion and command behavior of Vi. Custom commands can be implemented by adding Komodo macros to a Vi Commands Toolbox folder.
- HTTP Inspector: An interface for examining HTTP requests and responses as they happen. It runs a local proxy which intercepts HTTP traffic and records each transaction, which can then be viewed. The Inspector can break on a request or response, which can then be edited and submitted or re-submitted in its modified form.
- SFTP and SCP: Komodo now supports access to remote files via SFTP and SCP. Saved password information for all remote servers is stored securely in Mozilla's native password manager.
- JavaScript Debugging: Komodo now offers JavaScript debugging using the Firefox web browser and the JavaScript DBGP extension. With the extension enabled, loading JavaScript or triggering JavaScript controls in the browser window opens a debugging session in Komodo, which loads the relevant JavaScript code.
- JavaScript Interactive Shell: An interactive shell for manipulating JavaScript code is now available within JavaScript debugging sessions. This shell is similar in functionality to the other interactive shells in Komodo.
- Redesigned Code Intelligence system: reimplementation of PHP, Python, Perl, Ruby, JavaScript, XML and CSS support. The Code Intelligence system is the backend for many of Komodo's features, such as Autocompletion, Calltips and the code browser.
- PHP "Zero Configuration": improved automatic configuration for PHP debugging.
- Live Folders: Komodo projects now offer Live Folders which display current filesystem contents. The previous folder behavior is still available; these folders are now referred to as "Virtual Folders" in the documentation.
- Live Import: Projects can now automatically act as a Live Folder; importing, displaying and updating the contents of the base directory specified when it is created. Project-specific Directory Import preferences define which files and directories to include. New projects use Live Import by default.
- Project Settings: All project settings are now moved to the Project Properties dialog. This dialog box is now used for files, folders and projects, displaying the appropriate properties for each type.
- Additional Project functionality, including:
- Project based debugger preferences
- Basic file management (Delete, Rename, Show in File Manager)
- Project import from remote file systems
- New File option
- XML/HTML Autocomplete and CallTips: Komodo now supports AutoComplete and CallTips support for XML and HTML based on DTD or RelaxNG Schema. SGML and XML Catalogs are supported. The file being edited should contain a DOCTYPE declaration or a namespace in the root element, otherwise, only the current file data is used for completion.
- DOM Viewer: A new tab in the Project Pane (left) shows the DOM structure of XML and HTML documents in a tree view. Double-clicking on a node in the DOM Viewer moves the cursor to the corresponding node in the document.
- Help Browser: Komodo now uses Mozilla's help browser for displaying Komodo help.
- New languages: Support for Template-Toolkit, HTML-Mason, Smarty, Django, and Luddite has been added using UDL
- User-Defined Languages: Komodo 4 introduces a system for adding custom language support called UDL (User-Defined Languages) which allows Komodo to properly syntax-color multi-language files and templated files common in many web programming frameworks. For this release, Komodo includes better support for RHTML using this system. More multi-language files will follow in subsequent releases. Also included is a tool called Luddite which you can use to define custom language syntax-coloring and package those into Komodo extensions.
- Project Templates: Projects templates can be created and used when creating a new project.
- SCC History: A new option has been added to the Source Control menu which displays the revision history of a file. You can compare (diff) two selected revisions from the list, or select one and compare it to the local copy.
Additional improvements to existing features are listed in the Release Notes.The documentation for some of these features will be expanded for the final release.
Starting Komodo
Windows
From within the Windows environment, use one of the following methods to launch Komodo:
- double-click the Komodo desktop icon
- launch Komodo from the Windows program menu (Start|Programs|ActiveState Komodo __KO_SHORT_VERSION__|Komodo)
- right click a file name in Windows Explorer (and other dialogs that support the standard Windows right-click context menu) and select Edit with Komodo
To start Komodo from a command prompt, enter:
komodo [options] [filenames]
Multiple filenames may be specified; all specified filenames will be loaded in the Komodo editor pane.
The following command-line options are available:
- Help:
-hor--help - Show Komodo version:
-Vor--version - Open at a specified line number:
-l lineor--line=line - Open with a specified range selected:
-s rangeor--selection=range
(e.g.komodo -s 1,5-2,15 example.pywould openexample.pyand select from line 1 and column 5 to line 2 column 15)
Mac OS X
From within the OS X environment, use one of the following methods to launch Komodo:
- In the Dock, click the Komodo icon.
- In the Dock, click the "Finder" icon. In the left pane of the Finder dialog box, select Applications. In the right pane of the Finder, double-click the Komodo file.
- On the Finder's Go menu, click Applications. In the right pane, double-click the Komodo file.
To start Komodo from the Terminal:
If you want to start to Komodo from the command line, it is best to first create the following symlink:
sudo ln -s /Applications/Komodo.app/Contents/MacOS/komodo /usr/local/bin/komodo
Once the symlink is created, the following syntax applies:
komodo [options] [filenames]
All command line options described in the Windows section are available.
Linux
To start Komodo from a shell prompt, enter:
komodo [options] [filenames]
All command line options described in the Windows section are available.
Desktop icons and taskbar applets are not added automatically during installation on Linux. Check your window manager documentation for information on creating these manually. A choice of Komodo icons is available. By default, the icon files (.xpm) are stored in the Komodo installation directory.
The Komodo Workspace
The Start Page
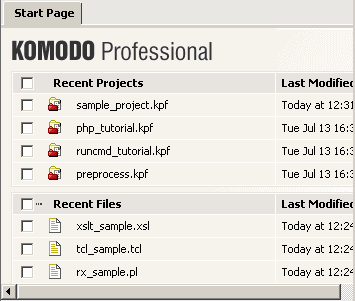
Komodo's Start Page is displayed by default when Komodo is first opened, and the Start Page tab persists when other files are opened. The Start Page provides quick access to recently opened files and projects. By default, the Start Page also displays links to tutorials and Komodo's Sample Project, as well as the Tip of the Day. Select Edit|Preferences|Appearance to change the contents of the Start Page, or to configure the number of recent files and projects.
To clear the names of selected files or projects from the Start Page, check the boxes next to the filenames, then click Remove. To clear the complete list of files or projects, click the "X" button at the top right of each list.
Note: Many Komodo interface icons have been updated for __KO_PRETTY_VERSION__ and may be different from those shown below.
Menus
The default drop-down menus are: File, Edit, Code, View, Debug, Project, Toolbox, Tools, Window, and Help. The functions accessed from each menu are described in detail in the relevant section of the User Guide. For example, the items accessed from the Debug menu are described in Debugging Programs.

Note: On Mac OS X systems, a menu labelled Komodo is displayed to the left of the File menu. On OS X, Komodo's Preferences dialog box is accessed by clicking Komodo|Preferences.
Context Menus
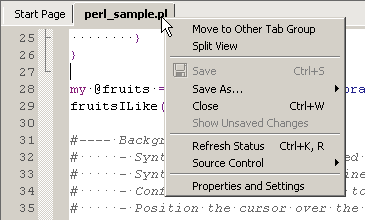
Komodo displays right-click context menus with options relative to the area of Komodo where the option was invoked, depending the location of the mouse pointer. Use the left mouse button to select items from context menus.
- Menu Bar Areas and Toolbar Areas: Options to view or hide individual toolbars and toolbar text (unavailable on Mac OS X).
- Projects Tab (Project Name): Options to open, save, activate, and close the projects, and to add a file to the selected project.
- Projects Tab (File Name): Options to edit, remove or export the selected file ,and access to source code control commands.
- Toolbox Tab: Options to work with the specified component.
- Editor Pane (File Editing Area): Options to cut, copy, and paste text, to set a breakpoint, and to edit the file properties and settings.
- Editor Pane (Tabs): Options to close the selected file and to view the file's properties and settings.
- Bottom Pane: The context menus available on tabs in the
Bottom Pane (e.g. the Debug tab and the
Breakpoints tab) contain subsets of Komodo's top-level menus.
Toolbars
To hide or show toolbars, or to hide or show button text, do one of the following:
- From the View menu, select Toolbars.
- Right-click on a menu bar or toolbar, and toggle the check mark beside the pertinent option.
- From the Edit menu, select Preferences. (On Mac OS X, from the Komodo menu, select Preferences.) Then, click the Appearance option and select or clear the desired options.
The Standard Toolbar provides quick access to common editing functions. Launch the Komodo User Guide by clicking the Help button.

The Tools Toolbar contains the commonly used commands on the Tools menu, including Preview in Browser, the Regular Expression Toolkit, the interactive shell, and the Object Browser.

The Workspace Toolbar toggles the main components of the Komodo workspace. Use this toolbar to show/hide the Left Pane, Bottom Pane and Right Pane, and to display or shift focus to a specific tab in one of these panes (e.g. the Toolbox tab).

The Debug Toolbar provides quick access to common debugging functions, such as Step In and Step Over. For more information about debugging programs, see Debugging Programs.

Use the Open/Find Toolbar to open files and search for strings. Find strings in files currently displayed in the editor or in files not currently open in Komodo but located on the filesystem. See Open/Find Toolbar for more information.

The Source Code Control Toolbar (available only in the Professional Edition of Komodo) makes it easy to work with files that are stored in Perforce or CVS. For more about using the Source Code Control Toolbar, see Source Code Control (Komodo Pro).

The Macros Toolbar makes it easier to record, play and save macros. For more information see Macros.

For users of PDK 6.0 and later, the PDK Toolbar provides quick access to Perl Dev Kit tools. Buttons for launching the core PDK tools (PerlApp, PerlSvc, PerlCtrl and PerlTray) are grayed out unless a Perl file is the active file in the Editor Pane. Availability of buttons also depends on which features are included in the currently installed PDK package. If the PDK is not installed on your system, all toolbar options are grayed out when the PDK Toolbar is displayed. For more information on how the PDK integates with Komodo, see Komodo and the Perl Dev Kit. The PDK is not available on Komodo for Mac OS X.

It is also possible to create Custom Toolbars consisting of items that are otherwise stored in the Toolbox or Komodo projects (e.g. run commands, code snippets and directory shortcuts).

Left Pane
The Left Pane of the Komodo workspace contains the Projects tab and the Code tab.
Projects Tab
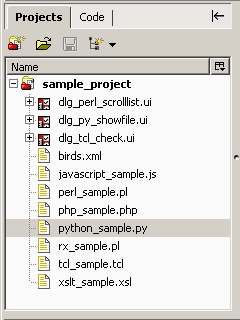
The Projects tab displays projects that are currently open. Hide or display the components contained in a project by clicking the plus sign to the left of the project name. To display the Projects tab, select View|Tabs|Projects, or use the associated key binding.
Related Topics:
Code Tab
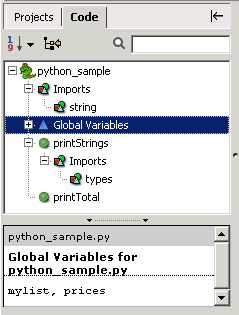
The Code tab displays a hierarchical view of all code symbols (for example, variables, methods, imports) in an open file. Symbols can be sorted and filtered, and the current scope of a symbol can be located. The lower part of the Code Browser provides additional documentation (when available) on program components. To display the Code tab, select View|Tabs|Projects, or use the associated key binding.
Related Topics:
Right Pane
The Right Pane of the Komodo workspace contains the Toolbox and, optionally, a Shared Toolbox.
Toolbox Tab
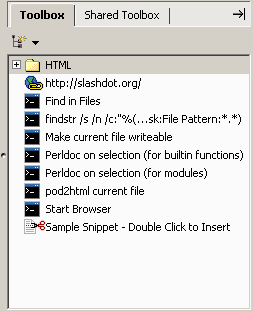
Use the Toolbox tab to manage and store Komodo components (for example, frequently used files, code snippets, commands, and URLs). Add items to the Toolbox, as well as to folders within the Toolbox. Items can be imported to the Toolbox and exported as Komodo project files and packages. Items added to the Toolbox are displayed with associated icons for easy identification. To display the Toolbox tab, select View|Tabs|Toolbox, or use the associated key binding.
Related Topics:
Shared Toolbox Tab
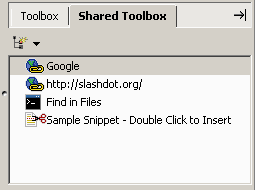
A Shared Toolbox has the same functionality as the Toolbox except that it can be shared among multiple users. For example, use a Shared Toolbox to store code snippets that are frequently used by a number of programmers. The Toolbox tab is only available if the Shared Toolbox preference has been set (select Edit|Preferences|Shared Support, or, on Mac OS X, select Komodo|Preferences|Shared Support).
Related Topics:
Editor Pane
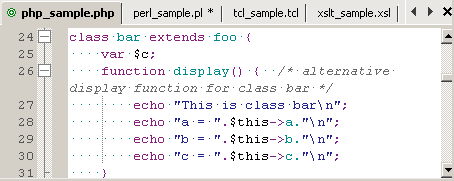
The large pane in the middle of the Komodo workspace is the Editor Pane. The Editor Pane is used for editing and debugging. Each open file has a corresponding tab at the top of the Editor Pane. Change the order of the tabs by clicking and dragging tabs to the desired position. The name of the active file (that is, the file that is currently displayed in the Editor Pane) is displayed in bold text. Use the left and right arrow buttons on the right side of the tabs to scroll though open files. Use the close button "X" on the right side of the tab display to close the active file. An asterisk beside the filename indicates that the file has been changed since it was opened, and needs to be saved. If a file is under source code control, a file status icon to the left of the filename indicates its current status.
Related Topics:
Bottom Pane
The Bottom Pane spans the width of the Komodo workspace and displays at the bottom of the screen. The Bottom Pane contains the following tabs:
- Breakpoints Tab: manage breakpoints and spawnpoints in the current debugging session(s)
- Command Output Tab: displays the results of commands run in the Run Command dialog box
- Find Results 1 and Find Results 2 Tabs: display the results of the Find All function
- SCC Output Tab: displays details of source code control commands, such as editing or checking in files
- Interactive Shell Tab: displayed when the interactive shell is launched as a stand-alone tool or from within a debugging session
- Debug Tab: consolidates views of the debugger output, call stack, program variables (local and global), and watched variables.

Managing Tabs and Panes
Use the View menu, Standard Toolbar or Komodo key bindings to choose which tabs are displayed in the Komodo workspace. Use the Standard Toolbar to show and hide the Left Pane, Right Pane and Bottom Pane.
Showing and Hiding Tabs
To display a tab in the Left Pane, Right Pane or Bottom Pane, select View|Tabs|<TabName>, or see Komodo's default key bindings (Help|List Key Bindings) for the appropriate keyboard shortcut. Alternatively, click the Show Specific Tab button on the Standard Toolbar.
Showing and Hiding Panes
To show and hide the Left Pane, Right Pane or Bottom Pane, click the associated button on the Standard Toolbar. Click the close arrow in the top right corner of a pane to close it.
Resizing Panes
When you are focusing on coding alone, you may want to maximize the Editor Pane. To increase the size of the Editor Pane, hide the Left Pane and the Right Pane. The Left, Right and Bottom Panes can be resized by clicking and dragging.
Enabling Full Screen Mode
To take advantage of as much of the Komodo workspace as possible, select View|Full Screen. When Full Screen mode is enabled, the workspace is maximized, and the toolbars and status bar are hidden. To restore the previous view, select View|Full Screen again.
Getting Started with the Sample Project
Komodo's sample project includes a number of programs in different languages. Use these sample programs to familiarize yourself with Komodo's functionality.
Opening the Sample Project and Files
On Komodo's Start Page, click Open Sample Project. The Sample Project and its associated files will display on the Projects tab.
To open a sample program, double-click the file name on the Projects tab. The contents of the file will display in the Editor Pane.
Editing a Sample Program
Komodo includes sample programs written in Perl, Python, JavaScript, PHP, Tcl, and XSLT. Each program is annotated with comments and exercises that describe Komodo's language-specific features. Open the sample programs for languages that interest you, and read the comments to explore Komodo's editing and debugging functionality.
Debugging a Sample Program
Komodo provides debugging support for Perl, Python, PHP, Tcl and XSLT. Komodo works with the core language distribution for Perl, Python and PHP to provide interpreter support. XSLT, on the other hand, is entirely self-contained. To debug the sample files for Perl, Python, PHP and Tcl, you must configure the location of the language interpreter. See Configuring the Perl Debugger, Configuring the Python Debugger, Configuring the Tcl Debugger, or Debugging PHP for instructions. Then open the sample file for the desired language, and view the comments in the "Debugging" section. General debugging functionality is discussed below.
- Breakpoints: In the sample program, click on the gray margin to the immediate left of the Editor Pane. A green circle will appear, indicating that a breakpoint has been set. When you run the debugger, program processing will stop at lines where breakpoints have been set.
- Start / Step Over / Step In: To start debugging, click the "Go" button on the Debug Toolbar. When debugging begins, the Bottom Pane will be displayed beneath the Editor Pane in the Komodo workspace. The program will run until a breakpoint is encountered; when program execution pauses at a breakpoint, click "Step In" to move through the program in single line increments, or "Step Over" to execute the entire function (as applicable), or "Step Out" to execute the remainder of a function (as applicable).
- Debug Tab: The tab labelled Debug: <filename> is displayed when debugging begins. In addition to the debug output, the Debug tab displays the call stack, variables, and variable values.